

Audit in 1–2 Weeks: Centralized Gym Reporting for Multi Site Owners

Centralized gym reporting means pulling membership, revenue, attendance, and class data from every location into one system so you’re reading the same numbers the same way across sites. It replaces a stack of spreadsheets and disconnected software logins with a single source of truth, which shortens decision cycles from weeks to days. If you manage more than one location and still reconcile numbers by hand each month, this is the fix, and the rest of this guide shows you how to build it.
TL;DR:
- Centralized reporting systems should use a single source of truth with standardized definitions for metrics like retention, churn, and ARPU to ensure consistency across locations.
- Building a dashboard with validation against manual records at one site helps catch formula mismatches and data discrepancies before full deployment.
- Automating key operational reports, such as weekly retention or monthly revenue, can significantly reduce reconciliation hours and improve decision speed.
- Using a single-platform approach simplifies architecture decisions, eliminates integration errors, and enables real-time data updates without complex ETL pipelines.
- Assigning a dedicated data steward and setting governance protocols are crucial to maintaining data quality and preventing drift in metric definitions.
Getfitnessflow
getfitnessflow.com
Bring Multi Site Reporting Together
Fitness Flow centralizes gym management, scheduling, billing, member engagement, and analytics for clearer decisions across multiple locations.
Table of Contents
- What Centralized Gym Reporting Actually Means
- Essential Reports and the KPI Formulas Behind Them
- The Real Payoff of Bringing Reporting Under One Roof
- Where Centralization Projects Usually Go Wrong
- How to Build a Centralized Reporting System, Step by Step
- The Systems That Feed a Centralized Reporting Layer
- Who Owns the Numbers: Governance That Keeps Reports Trustworthy
- How Fitness Flow Approaches Centralized Reporting
- Where to Start If You’re Doing This Yourself
- Get Your Reporting Running Without the Integration Headache
- Sources
- FAQ
What Centralized Gym Reporting Actually Means
Centralized reporting is the practice of routing data from every location, front desk, app, and payment processor into one place where it gets defined the same way and reported on the same schedule. That’s the plain definition. The harder question is architecture: how you actually get there.
Two paths dominate. The first is a single platform approach, where one piece of gym management software handles sales, scheduling, billing, and reporting for every site, so there’s no integration work because there’s nothing separate to integrate. The second is an integrated data layer, where you keep whatever point-of-sale, access control, and scheduling tools each location already uses, then build a pipeline (often called an ETL process, short for extract, transform, load) that pulls everything into a central warehouse or business intelligence tool.
Centralization changes who gets to define “truth.” Before it, a location manager might count an “active member” as anyone who scanned in this month; another might count anyone with a valid billing account. After centralization, one definition wins, and every dashboard inherits it. That’s the real shift: not just where data lives, but who has the authority to say what a number means.
You know it’s time to centralize when:
- You’re spending hours each week reconciling numbers that should already match across locations.
- Two managers report different retention rates for the same period using different formulas.
- Leadership can’t answer “which location is underperforming and why” without a phone call to each site.
- You’ve added a third location and the spreadsheet system that worked for two is now falling apart.
A single-platform approach tends to win for gyms under six or seven locations with fairly uniform operations. An integrated data layer makes more sense once you’ve got legacy systems at different sites that would be expensive to replace all at once.
Essential Reports and the KPI Formulas Behind Them
Dashboards only work if everyone agrees on what the numbers mean. Gym reporting converts raw operational data, memberships, visits, sales, and collections, into decisions operators can actually act on, but only when the underlying formulas are standardized across every site.
Start with membership metrics. Retention rate is calculated as (members at period end minus new members acquired during the period) divided by members at period start, times 100. Churn is simply the inverse: the percentage of members who canceled during a given window. “Active members” should be defined once, typically as anyone with a current, non-frozen membership, not anyone who happened to visit recently.
Revenue metrics need equal precision. Average revenue per user (ARPU) is total recurring revenue divided by active members for that period. Collections rate, the percentage of billed revenue actually collected, catches payment failures before they snowball into cash flow problems.
MetricFormulaReporting cadence
Retention rate
(End members − new members) ÷ start members × 100
Monthly
Churn rate
Canceled members ÷ start members × 100
Monthly
ARPU
Total recurring revenue ÷ active members
Monthly
Visits per member
Total check ins ÷ active members
Weekly
Class occupancy
Attendees ÷ class capacity × 100
Weekly
Lead to sale conversion
New members ÷ total leads × 100
Monthly
Operational KPIs round out the picture. Visits per member reveals engagement trends before they show up in cancellation numbers. Class occupancy tells you whether you’re overbuilding or underbuilding your schedule. Sales and CRM metrics, especially lead to sale conversion, should be reviewed monthly at minimum, weekly if you’re running active promotions.
The Real Payoff of Bringing Reporting Under One Roof
Consistency is the headline benefit, but it’s not the only one. Once every location reports on the same metric definitions, brand alignment stops being a slogan and becomes something you can actually measure: a member walking into any location gets the same pricing logic, the same class booking experience, and comparable service standards, because you can see when one site drifts from the rest.
Faster decisions follow naturally. When a retention dip shows up in week two instead of month three, you can launch a targeted win-back campaign at the affected location before it becomes a trend. Compliance gets simpler too. Waiver tracking, billing audit trails, and staff certification records are far easier to defend in an audit when they live in one governed system rather than scattered across five sites’ worth of paper files and local drives.
The financial case is where centralization earns its keep:
- Fewer reconciliation hours spent chasing why two spreadsheets disagree.
- Faster identification of underperforming locations before losses compound.
- Cleaner audit trails for billing disputes and compliance reviews.
- Better-targeted retention spend, since you can see exactly which cohort is churning.
Pro Tip: Bad data has a real dollar cost, not an abstract one. Poor data quality costs the U.S. economy an estimated $3 trillion a year, and a chunk of that comes from businesses making decisions on numbers nobody validated. A gym chain running five sets of “truth” is paying that tax every month, just in smaller denominations.
Where Centralization Projects Usually Go Wrong
Data quality is the most common failure point. If one location logs “walk in trial” members differently than another, your centralized dashboard will look clean while quietly reporting garbage. Garbage in still means garbage out, no matter how good the dashboard software looks.
Manager resistance is the second big obstacle, and it’s often underestimated. A location manager who has run their own spreadsheet for three years may see a centralized system as a loss of control, not a gain in insight. Skipping change management here is how good projects die quietly after launch.
Integration complexity bites hardest when legacy systems don’t play well together. Older access control systems and point-of-sale terminals sometimes lack modern APIs, forcing manual exports that reintroduce the exact inconsistency you’re trying to eliminate.
Watch for these specific traps:
- Chasing vanity metrics (total signups) instead of metrics tied to revenue or retention.
- Letting each location keep its own metric definitions “temporarily” during rollout, which becomes permanent.
- Skipping a data steward role, so nobody owns fixing discrepancies when they appear.
- Granting broad edit access to source data, which lets one careless change corrupt reports for every site.
Pro Tip: Assign one person as the data steward before you launch anything, not after. Even a part-time owner who checks new fields against defined formulas each month catches drift long before it reaches an executive dashboard.
How to Build a Centralized Reporting System, Step by Step
You don’t need a data team to pull this off. You need a phased plan, clear deliverables at each stage, and a willingness to pilot before you roll out everywhere.
- Audit your current systems. List every tool touching member or revenue data at each location: point-of-sale, access control, scheduling software, and any spreadsheets filling the gaps. Export a sample dataset from each and check for duplicate member records, inconsistent date formats, and missing fields. This phase typically takes one to two weeks for a five-site chain.
- Build your canonical metric model. Write down every KPI you’ll track and its exact formula, the same retention and ARPU definitions covered above. Circulate this document to every location manager for sign-off before building anything. Deliverable: a one-page metric dictionary everyone has agreed to.
- Choose your architecture. Decide between a single management platform and an integrated data layer built through ETL. If you’re weighing vendors, check for native reporting dashboards, open APIs, and whether the vendor supports data migration from your current systems without manual re-entry.
- Build dashboards and pilot with one location. Stand up your reporting dashboards using real data from a single representative site first. Validate every number against that location’s manual records for at least two full billing cycles before trusting the automation.
- Roll out, train, and set a governance cadence. Once the pilot checks out, roll out to remaining locations in batches rather than all at once. Train managers on reading the dashboard, not just producing it, and set a recurring cadence, weekly for operational metrics, monthly for financial ones, for reviewing the numbers together.
PhaseKey deliverableTypical timeline
Systems audit
List of data sources and quality issues
1 to 2 weeks
Metric model
Signed off KPI dictionary
1 week
Architecture decision
Vendor or ETL selection
2 to 4 weeks
Pilot
Validated dashboard at one site
4 weeks
Rollout
All locations live with training complete
2 to 3 months
Piloting with a single representative site before a full rollout is one of the more reliable ways to catch bad assumptions early, since it exposes formula mismatches while the blast radius is still one location instead of ten.
The Systems That Feed a Centralized Reporting Layer
Your reporting layer is only as good as the systems feeding it. Point-of-sale terminals hand over transaction data: payment method, item sold, timestamp, and location ID. Access control systems provide check in and check out timestamps, the raw material behind visits per member and peak hour analysis. Gym management software typically covers membership status, billing cycles, and class booking data all in one export.

Consumer-facing fitness apps can serve as secondary sources too. Some fitness tracking apps offer CSV export and detailed workout analytics that, when integrated correctly, add engagement data your core systems might miss, like workout frequency for members who track sessions independently.
Two integration patterns dominate. Real-time syncing through APIs or webhooks gives you same-day visibility but demands more engineering upkeep and error handling. Batch syncing, typically nightly CSV exports, is simpler to maintain and fine for most reporting needs that don’t require minute-by-minute accuracy.
After every sync, run a few basic checks:
- Compare total member counts between source system and dashboard to confirm nothing dropped during transfer.
- Spot check five to ten individual records against source data for field accuracy.
- Flag any location reporting zero activity, which usually signals a broken connection, not an empty gym.
Before committing to a vendor, confirm their API documentation is public, ask whether they support webhook notifications for real time triggers, and verify they’ve handled a migration of your data volume before.
Who Owns the Numbers: Governance That Keeps Reports Trustworthy
A dashboard is only as trustworthy as the process behind it. Assign a data owner for each source system, typically the location manager for front desk data and a finance lead for billing data, and a single reporting owner who resolves discrepancies across sites.
Access should follow a simple rule: everyone can view the dashboards, but only a small group can edit source metric definitions or reclassify data. That prevents a well meaning manager from “fixing” a number in a way that breaks comparability with every other site.
Changes to metric definitions need a real approval step, not a quiet edit. A one-line change request, reviewed by the reporting owner before it goes live, stops the slow drift where “active member” means something slightly different every quarter.
- Weekly: operational check, someone reviews sync logs and flags anomalies.
- Monthly: full KPI review across all locations against the canonical metric dictionary.
- Quarterly: executive report summarizing trends and any metric definition changes made that quarter.
How Fitness Flow Approaches Centralized Reporting
An all-in-one platform sidesteps a lot of the integration work described above simply because there’s nothing separate to integrate. Fitness Flow, for instance, is built to run sales, scheduling, billing, and member engagement inside one system, with reporting and analytics generated from the same data every location already uses.
Client-reported figures indicate member retention gains and administrative work savings, results Fitness Flow attributes to consolidating tools that previously ran on separate logins and separate spreadsheets.
Mapped against the implementation phases above, a single platform like this compresses the architecture decision (step 3) almost entirely, since dashboards come built in rather than requiring a custom ETL pipeline. It also supports the branded member app layer that keeps engagement data, like class attendance and workout logging, flowing into the same reporting system rather than a disconnected consumer app.
- Single system for sales, scheduling, billing, and reporting reduces the audit and integration burden.
- Branded member app centralizes engagement data alongside operational metrics.
- Built in analytics remove the need for a separate business intelligence tool during rollout.
Where to Start If You’re Doing This Yourself
If you’re building this without outside help, start smaller than you think you need to. Audit your systems first, even a rough one, before you touch any software decision. Write your metric dictionary second, because every dashboard built on undefined terms has to be rebuilt later anyway. Pilot with one location third, and resist the urge to launch everywhere at once just because the excitement is high.
Quick wins matter for buy-in. Automating a single weekly retention report that used to take a manager two hours by hand tends to convert skeptics faster than any presentation about long-term strategy. Get one manager to trust the numbers, and the rest of the rollout gets noticeably easier.
— Louis
Get Your Reporting Running Without the Integration Headache
Fitness Flow gives multi-location gyms a shortcut past most of the audit and integration work covered in this guide: sales, scheduling, billing, and reporting already live in one system, so there’s no ETL pipeline to build and no legacy point-of-sale data to wrangle before your dashboards work.
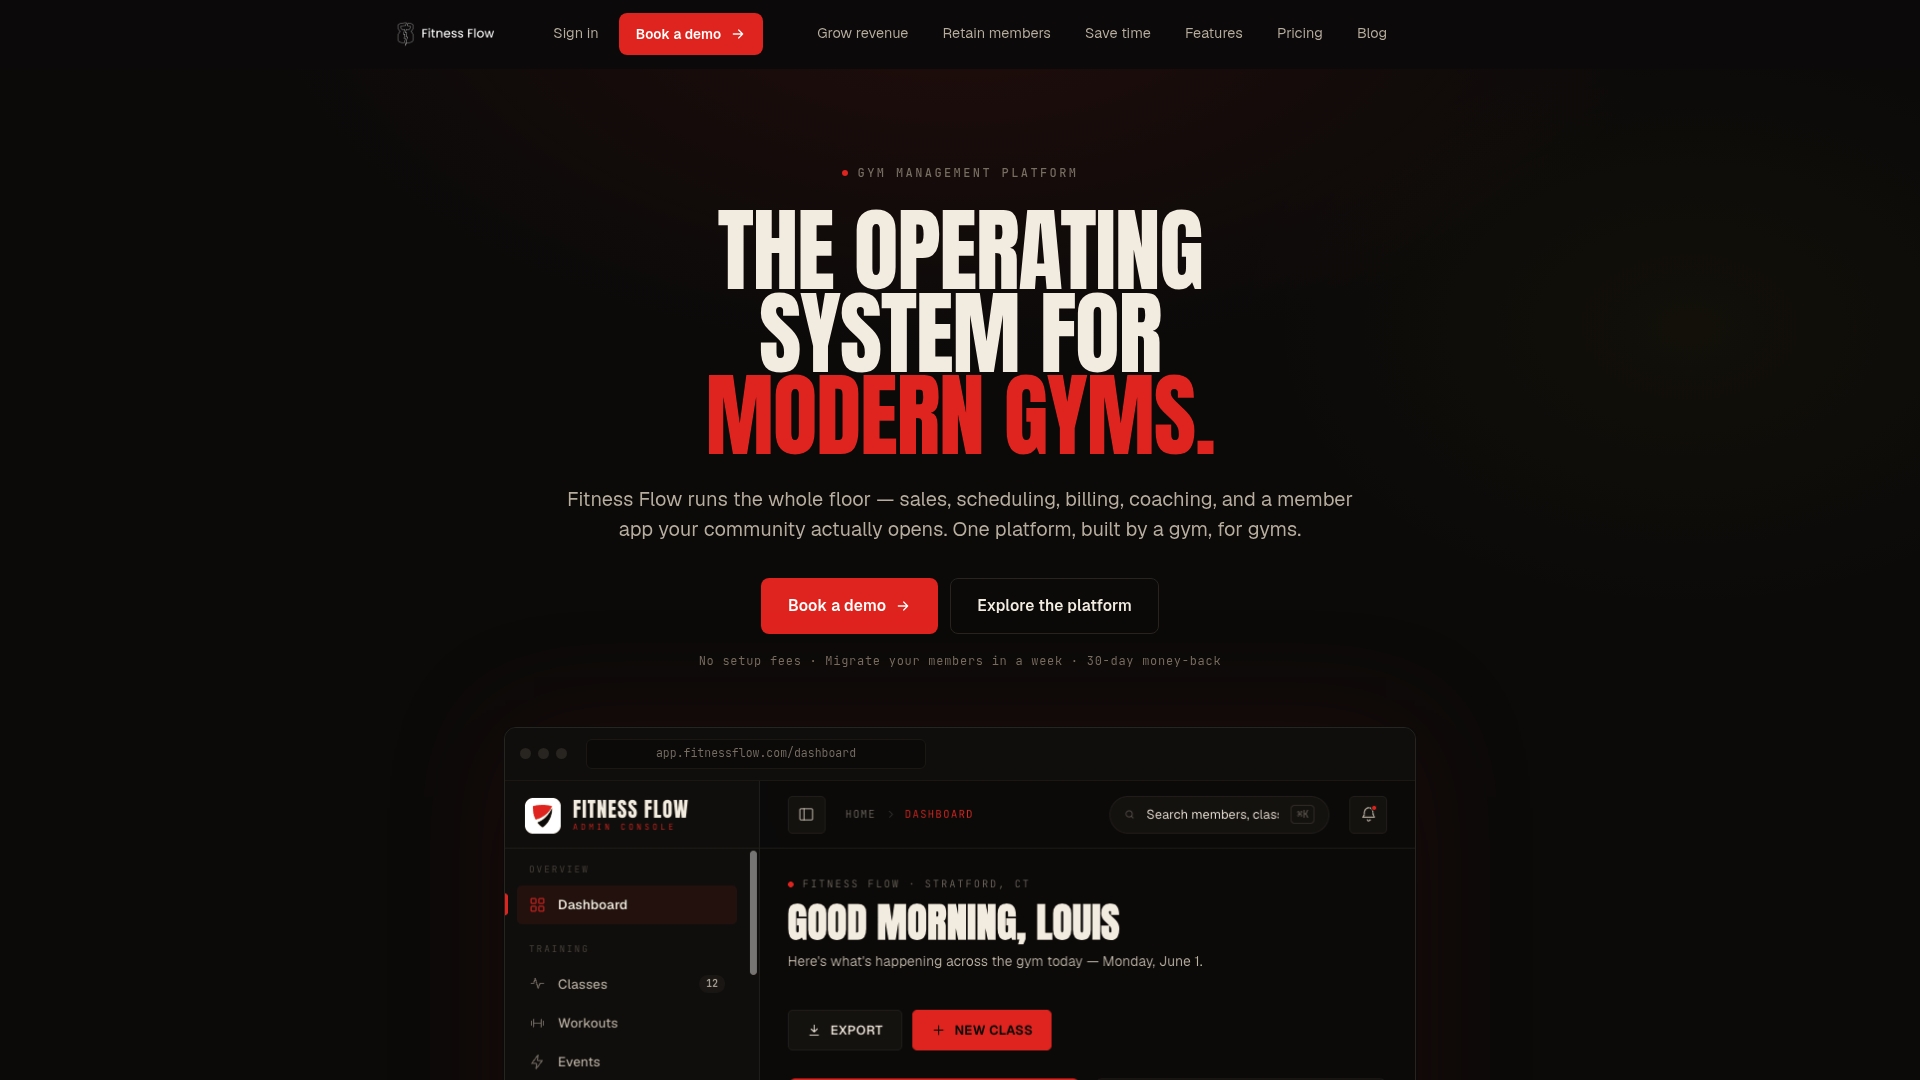
When you’re evaluating whether a platform fits your rollout, use the same criteria from the implementation framework above: does it support data migration without manual re-entry, does it produce the KPIs you actually need (retention, ARPU, class occupancy), and does it give managers a dashboard they’ll actually check weekly. Fitness Flow is built around those exact questions, with plans scaled to gym size, Solo at $149 per month, Studio at $349 per month, and Multi-site pricing available on request. If your reporting still lives in five disconnected spreadsheets, request a demo and see what a single source of truth looks like for your locations.
Sources
FAQ
What Is the 3-3-3 Rule in the Gym?
The 3-3-3 rule is a workout structuring concept, not a reporting or business metric, and it varies by trainer and program. It’s unrelated to the KPIs covered in this guide, so gym owners tracking centralized metrics won’t find it relevant to operational reporting.
What Is the Best CRM for a Gym?
The best CRM for a gym is one that shares data natively with your scheduling, billing, and reporting systems rather than running as a disconnected tool. Platforms like Fitness Flow build CRM functionality directly into the same system used for reporting, which avoids the export and reconciliation work a standalone CRM often creates across multiple locations.
Can I Write Off the Gym as a Business Expense?
Gym facility costs, equipment, software subscriptions, and staff wages are generally deductible business expenses for a gym operator, but personal gym memberships for non-business use typically aren’t. Consult a tax professional for your specific situation, since deductibility depends on how the expense is categorized and used.
What Is a CRM for a Gym?
A gym CRM is software that tracks leads, member communication, and sales pipeline activity from first inquiry through membership signup and renewal. Gym reporting systems pull this CRM data alongside membership and revenue figures to calculate conversion rates and sales performance across locations.