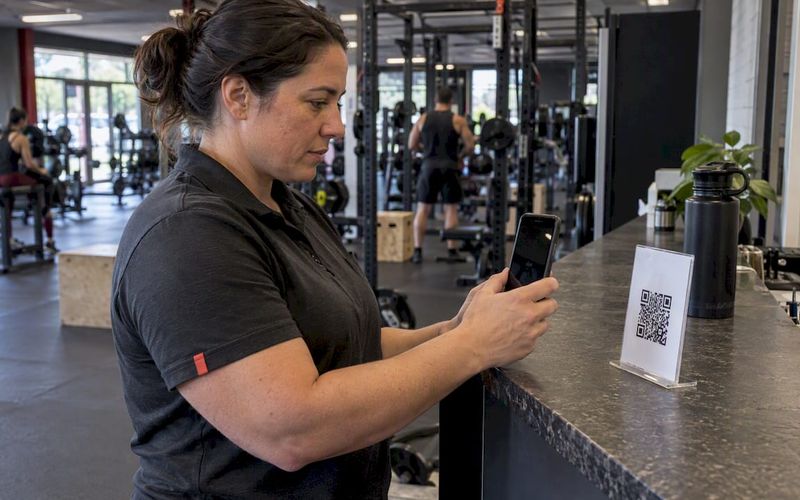

Gym Analytics for Owners: 3 KPIs to Boost Retention, No New Software

Gym analytics turns membership, attendance, and billing data into decisions that raise retention, optimize staffing, and lift revenue. Start small: centralize your member and attendance data in one place, then track three starter KPIs, retention rate, average revenue per member, and class utilization, before adding anything more complex.
TL;DR:
- Tracking retention rate and class utilization helps identify scheduling and member engagement issues before cancellations occur, enabling proactive intervention.
- Prioritizing key KPIs like retention rate, average revenue per member, and attendance allows gyms to focus on actionable insights rather than collecting unnecessary data.
- Most gyms already have the necessary data scattered across multiple systems, but integrating and analyzing it centrally is essential for meaningful insights.
- Implementing a simple, disciplined approach by monitoring few metrics weekly and assigning ownership increases the chances of sustained improvement.
- Avoid tracking vanity metrics or outdated data to prevent misleading conclusions and ensure data privacy and accurate reporting.
Getfitnessflow
Turn Gym Data Into Retention Decisions
Fitness Flow brings gym analytics, member engagement, scheduling, and billing together in one platform for more informed decisions.
Table of Contents
- Why Gym Analytics Matters for Your Bottom Line
- Which KPIs Should Gyms Track First?
- Where Does Gym Analytics Data Actually Come From?
- How Do You Actually Implement Gym Analytics?
- How Do You Measure ROI on Gym Analytics?
- What Mistakes Sink Gym Analytics Programs?
- Fitness Flow’s Own Retention Results: A Case Study
- What I’ve Learned Watching Gyms Adopt Analytics
- How Fitness Flow Puts This Into Practice
- Sources
Why Gym Analytics Matters for Your Bottom Line
Most gym owners already sense which members are drifting away. Gym analytics replaces that gut feeling with a number you can act on before the member cancels, not after.
Retention is where analytics pays off fastest. When you can see attendance dropping off for a specific member three weeks before they miss a payment, you can intervene with a call, a class invite, or a check-in. That single habit, watching attendance trends instead of waiting for cancellation notices, is often the difference between a member who re-engages and one who quietly disappears. Industry writeups on gym analytics point to retention, scheduling efficiency, and marketing ROI as the three benefits owners notice first once they start tracking data seriously.
Operational savings show up almost as quickly. Attendance patterns tell you which classes are overstaffed and which time slots are wasting instructor hours. Equipment usage data flags machines sitting idle in a corner that could be swapped for something your members actually want.
Revenue opportunities are the part most owners underestimate. Analytics surfaces:
- Members who attend often but never buy personal training or supplements, an obvious upsell target
- Pricing tiers that convert well versus ones nobody chooses
- Peak hours where you could justify a premium class or add-on service
- Secondary spend patterns (retail, PT sessions, nutrition coaching) tied to specific member segments
None of this requires guesswork once the data exists. It requires someone actually looking at it every week.
Which KPIs Should Gyms Track First?
Not every metric deserves a place on your dashboard. Fitness On Demand’s gym metrics guide groups the ones that matter into four buckets: retention and churn, engagement and utilization, revenue and secondary spend, and acquisition and growth. Here’s how to prioritize them and calculate each one.
- Retention rate and churn rate. Retention rate = (members at end of period − new members acquired) ÷ members at start of period × 100. Churn is simply 100 minus retention. If you started the month with many members, gained some, and ended with slightly more, your retention rate is high. This is the single number that tells you whether your gym is a leaky bucket or a growing business.
- Average revenue per member (ARPM). Total monthly revenue ÷ total active members. ARPM captures dues plus secondary spend, so a gym charging $60 a month but averaging $85 in ARPM is quietly monetizing retail and PT sales well.
- Attendance and class utilization. Attendees ÷ class capacity, tracked per class and per instructor. A yoga class running at 35% capacity on Tuesday mornings is a scheduling problem, not a marketing one.
- Class participation rate. Unique members attending at least one class ÷ total active members. Low participation often predicts churn months before it happens.
- Cost per acquisition (CPA). Total marketing spend ÷ new members acquired in that period. This tells you whether your ad spend is actually profitable once you factor in average member lifetime value.
- Lifetime value (LTV). ARPM × average membership length in months. LTV and CPA together answer the only question that matters for growth: are you spending less to acquire a member than that member is worth?
Pro Tip: Calculate your own retention baseline before comparing yourself to any industry average. A 90% retention rate might be excellent for a boutique studio and mediocre for a big-box gym with annual contracts.
The Fitness On Demand guide recommends exactly this: set an internal benchmark first, then use external averages only as a sanity check, not a target.
Where Does Gym Analytics Data Actually Come From?
Analytics is only as good as the systems feeding it. Most gyms already generate the data they need. It’s just scattered across five different logins nobody checks together.
The core data sources are:
- Member CRM and billing systems track sign-ups, plan tiers, payment failures, and cancellation reasons.
- Access control and attendance logs show who actually shows up, and when, versus who just pays and disappears.
- Class booking platforms reveal capacity, no-show rates, and instructor performance across your schedule.
- Point-of-sale systems capture secondary spend on retail, drinks, and add-on services.
- Integrations and APIs connect these systems so a member’s attendance, billing, and purchase history live in one dashboard instead of four spreadsheets.
Wearables and on-demand content are optional, higher-value additions. Developer libraries like ts-health show how metrics such as heart rate variability, training stress score, and sleep data get normalized across different device brands, which matters if you ever want to layer performance coaching on top of operational analytics. For gyms wary of storing sensitive health data centrally, privacy-first platforms like Athilio demonstrate a workable alternative: local-first storage with custom dashboards, so you get the insight without becoming a liability for personal health information.
Digital signage is an underused data output, not just an input. Zoney’s writeup on in-club displays shows gyms surfacing attendance streaks and challenge leaderboards pulled straight from their analytics, turning a back-office number into a visible reason for members to show up again.

How Do You Actually Implement Gym Analytics?
Skip the temptation to buy a dashboard tool on day one and figure out the rest later. Sequence matters more than software here.
- Set goals and map them to specific KPIs. Decide whether this quarter is about retention, revenue, or utilization, and pick two or three metrics that measure exactly that, not everything at once.
- Audit what data you already have. Pull your last three months of CRM exports, attendance logs, and POS reports. Most gyms discover half the data they need already exists; it’s just never been combined.
- Choose your first dashboard. Start with a single view: retention rate, ARPM, and class utilization. Resist adding wearables or predictive models at this stage, phased rollouts starting with operational data consistently outperform trying to integrate everything at once.
- Pilot for 30 days, then review. Assign one manager to own the dashboard and report on it weekly. Adjust which metrics matter based on what actually predicts churn or revenue at your gym.
- Scale to additional locations or metrics. Once the pilot metrics are stable and trusted, add secondary spend tracking, acquisition costs, or wearable integrations.
Pro Tip: Assign one specific person to own the weekly numbers review, not “the team.” Shared ownership of a dashboard usually means nobody actually opens it.
Build in a recurring 15 minute Monday meeting where whoever owns the dashboard reports one win and one problem number. That cadence matters more than the sophistication of your tools.
How Do You Measure ROI on Gym Analytics?
The math is simpler than most owners expect.
Realistic milestones look like this:
- 90 days: A working dashboard, a clean baseline for retention and ARPM, and at least one intervention (a win back campaign, a schedule change) tied directly to a metric.
- 6 to 12 months: Measurable retention improvement, a documented CPA and LTV, and staffing or class schedule adjustments backed by utilization data.
The SBA’s guidance on data-driven planning frames this correctly: analytics adoption is a business planning exercise, not a technology purchase. When you present results to stakeholders or investors, lead with the retention percentage change and the dollar impact, not the software features. Numbers that tie to revenue get remembered; dashboard screenshots don’t.
What Mistakes Sink Gym Analytics Programs?
The most common failure isn’t bad data. It’s tracking the wrong things well.
Vanity metrics, total app downloads, social media likes, gross sign-ups without accounting for churn, feel productive but tell you nothing about whether members are actually staying. Duplicate member records from old CRM migrations quietly inflate your member count and understate your real retention rate.
Integration health matters more than most owners realize. A billing system that stops syncing with your CRM for two weeks can silently corrupt a month of retention calculations, and nobody notices until the numbers look wrong for reasons nobody can explain.
Before you scale any analytics program, run through this short checklist:
- Confirm no duplicate or merged member records are inflating your active count
- Verify your integrations sync daily, not just on setup day
- Get explicit member consent before collecting wearable or health-adjacent data
- Store personal health information separately from general billing and CRM data
- Review who inside your organization actually has access to sensitive member data
Privacy isn’t just a legal issue. Members who feel surveilled disengage faster than members who feel invisible.
Fitness Flow’s Own Retention Results: A Case Study
Analytics dashboards built around the principle this article argues for—track fewer metrics, but track the right ones consistently—can report an average increase in member retention and a reduction in administrative work time that used to go into manually reconciling attendance, billing, and CRM data across separate tools.
The gains didn’t come from a single feature. They came from putting retention rate, attendance trends, and secondary spend on one screen that a manager actually checks every week instead of chasing four different logins.
The dashboards that drove these results focused on:
- Weekly retention and churn tracking tied to automated win back messages
- Class utilization data used to rebalance instructor schedules
- Member engagement scores from the branded app, flagging drop off before cancellation
If you’re starting from scratch, the replicable takeaway isn’t the software. It’s the discipline: pick three KPIs, put them in one place, and assign a human to act on what they show.
What I’ve Learned Watching Gyms Adopt Analytics
The biggest objection owners raise isn’t cost. It’s time, the fear that analytics means another system to babysit on top of everything else running the gym. That objection usually dissolves once a manager sees one specific save, a member who got a call after three missed classes and renewed instead of canceling. That single anecdote does more to build internal buy-in than any spreadsheet full of projected ROI.
Momentum comes from stacking small, visible wins early rather than promising a transformation in the first month. Show the front desk staff one number that changed because of something they did, and adoption stops being a mandate from ownership and starts being something the team wants to keep doing.
— Louis
How Fitness Flow Puts This Into Practice
A platform built around the sequence this article recommends: centralize your member data first, then let the KPIs surface themselves. Instead of stitching together a CRM, a billing tool, a scheduling app, and a separate reporting dashboard, one system runs all four together, so the retention, attendance, and revenue numbers you need are already connected the day you turn it on.
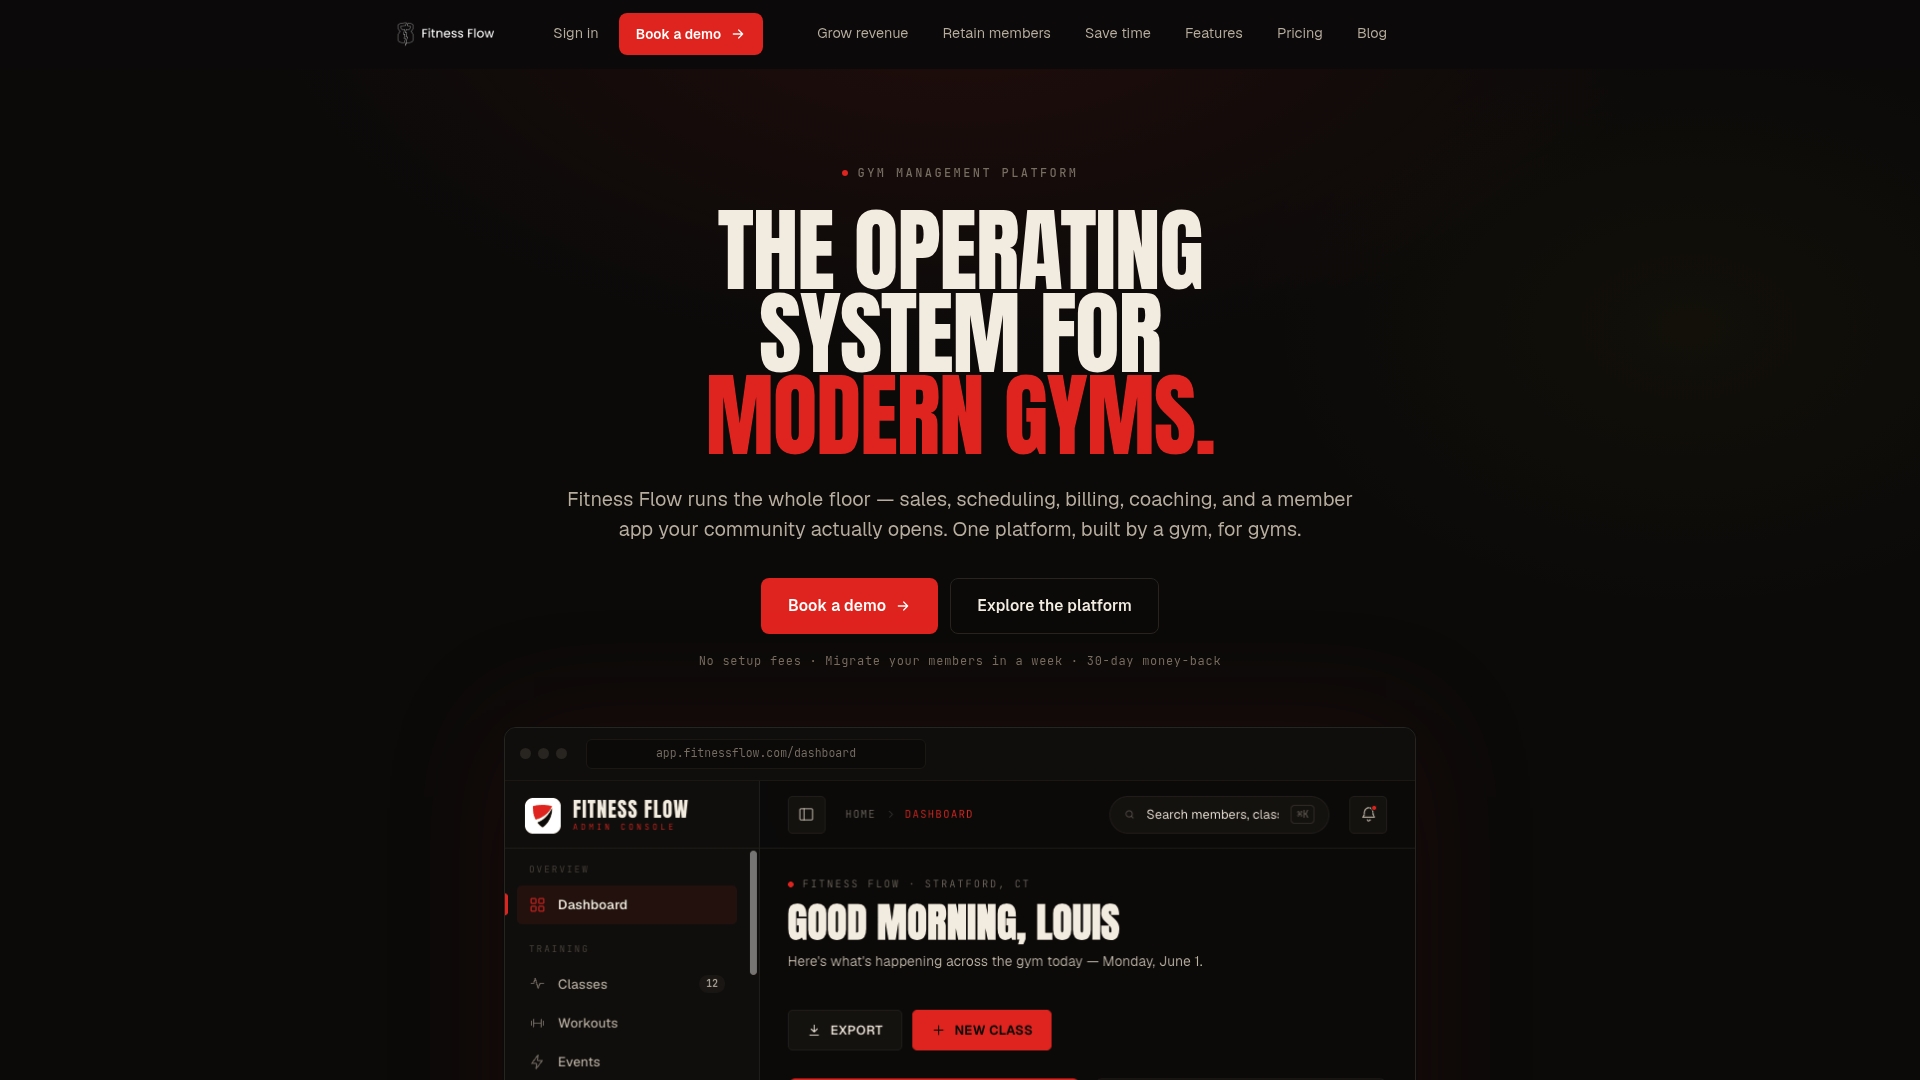
A demo walks through your own gym’s data model. You’ll see how the branded member app feeds engagement scores directly into your retention dashboard, how billing and attendance sync automatically, and how class utilization reports update in real time instead of at month end.
If your gym is still exporting spreadsheets from three separate systems every week, book a Fitness Flow demo and see what a single connected dashboard looks like for your own member data.