

Catch Gym Members 60–90 Days Early With Deployable Churn Prediction

Member churn prediction uses attendance, payment, and engagement history to flag which members are likely to cancel before they actually do. The payoff is concrete: catch the warning signs 60 to 90 days out, intervene with the right offer or outreach, and you convert members who would have quit into members who renew. Most working models lean on tree-based machine learning, and the single strongest signal across studies is simple: how long it’s been since someone last showed up.
TL;DR:
- Models relying on attendance data, especially days since last visit, outperform demographic or payment history for predicting member churn within a 90-day window.
- Separating voluntary cancellations from involuntary churn due to failed payments is essential to avoid misguiding retention strategies.
- Using a simple model with just three features—days since last visit, 90-day visit count, and payment status—can outperform more complex setups.
- Decision-tree ensembles and gradient boosting models, validated with time-aware testing, provide explainable insights critical for actionable retention efforts.
- An integrated platform that consolidates attendance, billing, and engagement data accelerates the transition from risk scores to effective retention interventions.
Getfitnessflow
Keep Members Engaged Between Visits
Fitness Flow brings scheduling, billing, attendance, analytics, and member engagement together in one platform for modern gyms.
Table of Contents
- What Is Member Churn Prediction, and Why Does the Time Window Matter?
- Which Data Signals Actually Predict a Member Leaving?
- Which Model and Metrics Actually Matter for Retention Work?
- How Do You Build and Deploy a Churn Model Step by Step?
- How Should Risk Tiers Map to Retention Actions?
- What Mistakes Break Churn Models, and How Do You Avoid Them?
- How Does an Integrated Platform Speed Up the Model-to-Action Loop?
- Should You Build a Churn Model In-House or Buy a Platform?
- A Faster Path From Risk Score to Retained Member
- Sources
- FAQ
What Is Member Churn Prediction, and Why Does the Time Window Matter?
Churn prediction only works if you first agree on what “churned” means, and most gyms get this wrong. Voluntary churn (a member actively cancels) and involuntary churn (a credit card fails and nobody catches it) look identical in a revenue report but require completely different fixes. Lumping them together is one of the fastest ways to build a model that gives bad advice.
The time window matters just as much as the definition. A 30 day window catches fast quitters but misses slow fade outs. A 365 day window smooths out seasonal noise but reacts too slowly to help anyone. Most fitness-industry models settle on a 90 day horizon, and for good reason: roughly half of new members who cancel do so within their first 90 days.
That front-loaded risk explains why the business case is so strong. A five-point bump in retention can lift profit by a wide margin, since retained members cost far less to keep than new members cost to acquire. A few things to lock down before you build anything:
- Define churn as a specific event: no charge, no visit, and no reschedule within your chosen window.
- Pick one horizon (90 days is the industry default) and apply it consistently across cohorts.
- Separate voluntary cancellations from failed payments in your reporting from day one.
Which Data Signals Actually Predict a Member Leaving?
Attendance data beats everything else. Across peer-reviewed testing, the number of days since a member’s last visit was the top predictor in every model tested, outperforming demographic data, membership tier, and even payment history alone. If you collect nothing else, collect this.
Beyond raw attendance, a handful of fields consistently earn their place in a working model:
- Attendance frequency and recency: visits per week and days since last check-in.
- Booking cadence: how far in advance a member books, and whether that lead time is shrinking.
- Payment health: failed charges, retries, and time-to-resolve.
- Tenure: new members and multi-year members churn for different reasons and at different rates.
- Engagement signals: app logins, class ratings, or survey responses where available.
Raw event logs are not features. You need to engineer them. Rolling-window counts (visits in the last 30, 60, and 90 days) smooth out single bad weeks. Delta features, which measure the change between this month’s visit count and last month’s, catch a slow fade before it becomes a cancellation. Recency-frequency pairings, like days-since-last-visit combined with 90-day visit count, consistently outperform either metric alone.
Three data-quality habits save you from building a model that lies to you. Lock your denominator so you’re comparing the same population across time windows. Exclude members who joined mid-window, since their short history skews averages. And never blend failed-payment events with genuine cancellations in your training labels; a basic weighted engagement score that separates these can outperform gut-feel triage by a wide margin.
Pro Tip: Build your first version with just three fields: days-since-last-visit, 90-day visit count, and payment status. It will outperform most “comprehensive” models built on twenty half-clean fields.
Which Model and Metrics Actually Matter for Retention Work?
Start simple, upgrade only when the data justifies it. Logistic regression makes a fine baseline: it’s fast, explainable, and good enough to prove the concept to skeptical stakeholders. But decision-tree ensembles, gradient boosting and random forests specifically, consistently outperform simpler models on fitness churn data while still producing feature importances and partial dependence plots that a non-technical operations team can actually read.
That readability matters more than people assume. A model that says “this member’s risk jumped because their visits dropped from 3/week to 1/week” gets acted on. A model that spits out an unexplainable probability score gets ignored.
Accuracy is the wrong headline metric here, because churn is imbalanced: most members don’t cancel in any given window, so a model can be 90% “accurate” while missing every at-risk member. Watch these instead:
- PR-AUC (precision-recall AUC): measures performance on the minority class you actually care about.
- Precision at a fixed recall: tells you how many false alarms you’ll generate to catch, say, 70% of churners.
- Lift and capture rate: how much better your top-risk decile performs versus random targeting.
Validate with a time-aware holdout, never a random shuffle. Train on members from months one through ten, test on months eleven and twelve. Random shuffling leaks future information into training and produces a model that looks great in testing and fails in production, a mistake the original PMC study specifically flags as a common trap.
How Do You Build and Deploy a Churn Model Step by Step?
Building a working churn predictor is less about algorithm choice and more about discipline in five stages.
- Define the label and horizon. Pick your churn definition (voluntary cancellation, no renewal) and your prediction window (90 days is the standard starting point). Lock the denominator so every cohort is measured the same way.
- Assemble and clean the data. Pull attendance logs, billing records, and engagement events into one table. Fix timezone mismatches and duplicate check-ins before anything else.
- Split time-aware, then engineer features. Create your train/test split by date, not randomly. Build rolling-window counts, delta features, and recency-frequency pairs, then test explicitly for leakage, meaning any feature that could only exist because the member already churned.
- Select a model with temporal cross-validation. Run logistic regression as a baseline, then a gradient-boosted model. Compare using PR-AUC and precision at your target recall, not accuracy.
- Set thresholds and deploy. Convert probability scores into risk tiers, wire the scores into your CRM or membership platform, and instrument an A/B test so you can prove the intervention, not just the prediction, moves retention.
Deployment is where most projects quietly die. A model sitting in a data scientist’s notebook saves nobody. It needs to land as a flag in the same tool your front-desk staff and coaches already use, triggering a task or an alert automatically.
Pro Tip: Run your first deployment as a shadow test: score members for four weeks without acting on the output. Compare who the model flagged against who actually churned before you trust it with real interventions.
Once live, monitor for drift monthly. A model trained on pre-holiday attendance patterns will misfire in January unless you retrain or recalibrate on a regular cadence.
How Should Risk Tiers Map to Retention Actions?
A probability score is useless until you turn it into a tier and a specific action. Most gyms find three tiers work well operationally:
- High risk (top 10 to 15% of scores): expect the highest capture rate of actual churners, but also the smallest group, so it’s cheap to act on personally.
- Medium risk (next 20 to 25%): larger group, lower individual probability, best served by lighter-touch automated nudges.
- Low risk (remaining members): no action needed beyond standard engagement.
Behavioral segmentation sharpens this further. Research on fitness center dropout identifies a specific persona worth naming: the “enthusiastic absentee,” a member who rates the gym highly on surveys but has stopped showing up. Clusters built on behavioral signals rather than attitude alone show churn rates as high as 21 to 24% in these groups, compared to 4 to 7% among consistently engaged members. A satisfaction survey alone would never catch this group; only attendance data does.
Timing beats almost everything else in this equation. Interventions started 90 or more days before a renewal date run roughly twice as effective as ones started just 30 days out, and members with low engagement scores are several times more likely to lapse than highly engaged peers, according to the same research. That means your onboarding window (the first 30 to 90 days) and your pre-renewal window deserve the bulk of your attention, with long-tail win-back campaigns as a lower-priority third bucket.
Match the tactic to the persona. A coaching check-in call works for a drifting long-tenure member. A class nudge notification works for someone who just needs a reminder. A personalized offer works for a price-sensitive member nearing renewal. And for payment failures specifically, a dunning recovery flow, not a retention offer, is the right tool; you can borrow tactical ideas from broader

What Mistakes Break Churn Models, and How Do You Avoid Them?
Data leakage kills more churn models than bad algorithms do. The classic trap: including a feature like “cancellation request submitted” in training data, which only exists because the member already decided to leave. Any field generated after your prediction point contaminates the model.

Backfilled or inconsistent labels cause a quieter version of the same problem. If your churn definition changed six months into your data history, your model is learning two different patterns as if they were one.
Quick governance habits to build in from the start:
- Split voluntary and involuntary churn in every report; a failed-payment spike is a billing problem, not a satisfaction problem.
- Retrain on a fixed schedule (quarterly is common) and check for accuracy drift, not just at launch.
- Minimize personally identifiable data in model inputs, store it securely, and get explicit opt-in before using survey or biometric data in scoring.
How Does an Integrated Platform Speed Up the Model-to-Action Loop?
Most of the delay in churn prediction isn’t the modeling. It’s stitching together attendance logs, billing exports, and engagement data that live in three different tools before you can even start. A platform like Fitness Flow centralizes those signals in one place, which removes the integration work that stalls most in-house projects for months.
Treat those as claims worth evaluating against your own numbers, not guarantees, but they point to a real pattern: when attendance, billing, and a branded member app share one data layer, the automated workflows that act on risk scores, class nudges, check-in prompts, personalized offers, can fire immediately instead of waiting on a manual export.
Should You Build a Churn Model In-House or Buy a Platform?
Building in-house makes sense if you already have a data scientist and a large, complex membership program worth the custom investment. For most gym owners and studio operators, an integrated platform gets you from prediction to action faster, because the attendance, billing, and engagement data are already unified. If you have the team, pilot a small model this quarter. If you don’t, a platform demo will tell you more in an hour than a build estimate will.
— Louis
A Faster Path From Risk Score to Retained Member
An integrated platform gives you the attendance, billing, and engagement data churn models need, unified instead of scattered across multiple tools. That’s the real advantage: you skip the months of integration work described above and go straight to running risk-based workflows.
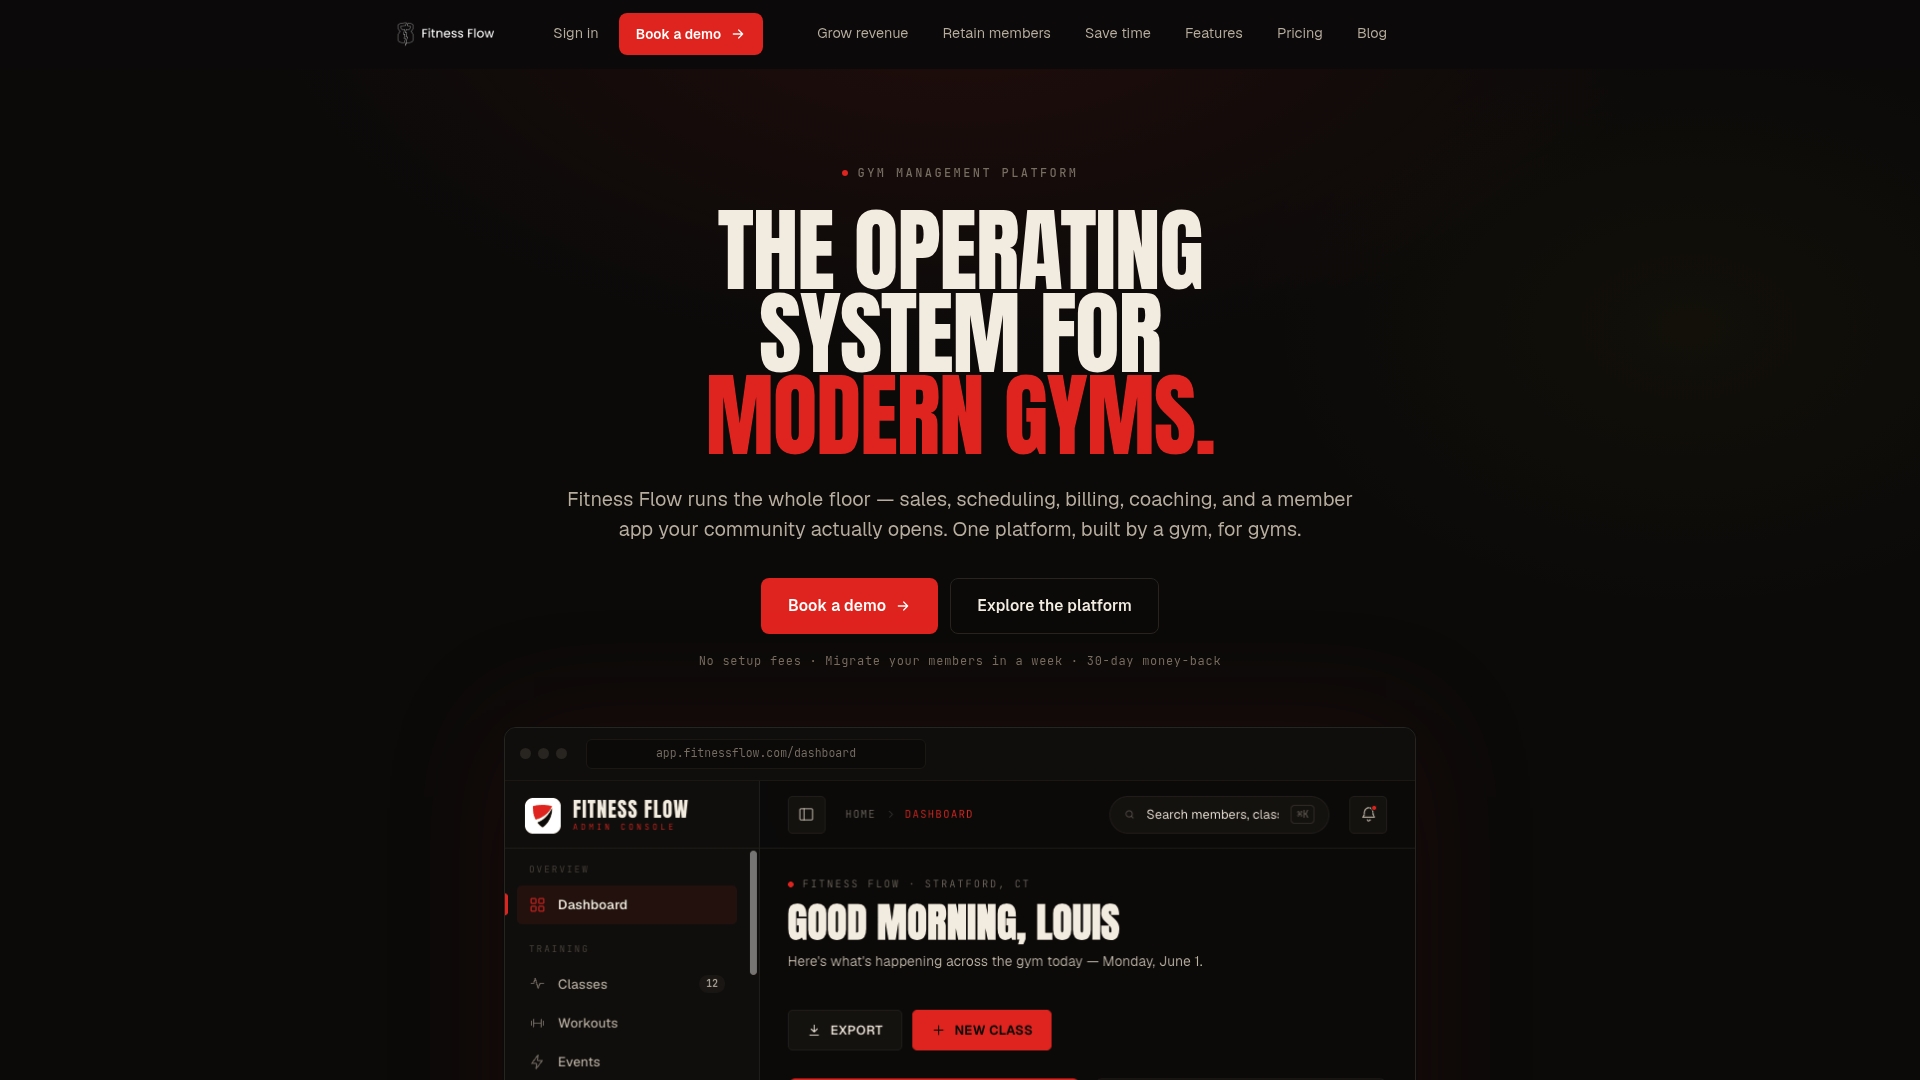
The platform tracks attendance and payment failures automatically, feeds a branded member app that keeps engagement visible, and surfaces analytics dashboards built to spot the early warning signs discussed in this guide. Automated workflows can trigger a class nudge or a personalized offer the moment a member’s risk profile shifts, without anyone manually pulling a report. Current pricing details are available on the company’s website. Check current plans and features and book a demo to see how your own attendance data would score under a working churn model.
Sources
- Predicting Fitness Centre Dropout — PMC
- Predictive Analytics for Member Retention: A Practical Guide — i4a
- Fitness Studio Member Retention: Key Stats (2026) | Regulr Blog
- Who churns from fitness centres? Evidence from behavioural and attitudinal segmentation — 2024
FAQ
What Does Churn Prediction Mean?
Churn prediction means using historical member data, mainly attendance, payments, and engagement, to calculate the probability that a specific member will cancel within a set time window, usually 90 days. Tree-based models like gradient boosting are among the most accurate approaches tested for this in fitness settings.
How Do You Calculate Membership Churn?
Membership churn rate is calculated by dividing the number of members who canceled during a period by the total number of active members at the start of that period. Separate voluntary cancellations from failed-payment losses before calculating, since blending the two distorts the rate and hides the real problem.
What Does a 20% Churn Rate Mean?
That figure sits above healthy industry benchmarks, and given that roughly half of all cancellations happen within the first 90 days, a rate that high usually points to an onboarding problem rather than a general satisfaction issue.
Can AI Predict Customer Churn?
Yes. Machine learning models, particularly gradient boosting and random forest ensembles, reliably predict churn using attendance and payment history, with days-since-last-visit ranking as the strongest single predictor across tested models. Platforms like Getfitnessflow apply this kind of scoring automatically using data already collected through normal gym operations.
How Accurate Is a Typical Churn Model for Gyms?
Accuracy varies by data quality, but published research on fitness-center dropout shows decision-tree ensembles achieving strong predictive performance when attendance and payment features are included. Precision and recall matter more than a single accuracy number, since churn is a minority-class problem and raw accuracy can be misleading.